Short answer: I am not sure.
New York
A recent report authored by appraiser Miller Samuel Inc. found that Manhattan (NYC) condo and co-op sales declined by 25% from last year’s first quarter. It was the largest drop since the 2009 financial crisis.
Was the lack of sales due to low inventory much like the greater Los Angeles area? Not according to the report. The average sales price dropped 8% with a lot to blame on the high-end market where overpriced luxury apartments are sitting on the market on average for MORE than a year and a half.
When looking at the best indicator, median sales price (emphasis on median, not average), things were not as bad; prices slipped by only 2%. So the issue seems to be with more expensive, luxury real estate in NYC.
Jonathan Miller, president of Miller Samuel, said, “There is a lot of uncertainty in the market.” Some of those uncertainties revolve around tax reform’s impact on real estate, threat of a trade war with China, North Korea, interest rates rising, and potential inflation. Miller opined, “The next couple of years will be all about price discovery,” when referring to the Manhattan (NYC) market.
With sharp movements in the interest rate market and wild swings in the stock market, maybe a lot of markets are working on “price discovery.”
How Does This Impact the South Bay?
I have studied in great lengths the past downturns and what I have found is that the higher-end part of the market tends to be the first to bow out of a market. You could call this the “smart money.” NYC tends to harbor the smartest and wealthiest home buyers in the world. If they are fatigued with prices there, is that our first indicator that the real estate market is showing some cracks?
A great chart shown below by First Tuesday (last updated May 9, 2017) illustrates the different price tiers in California.
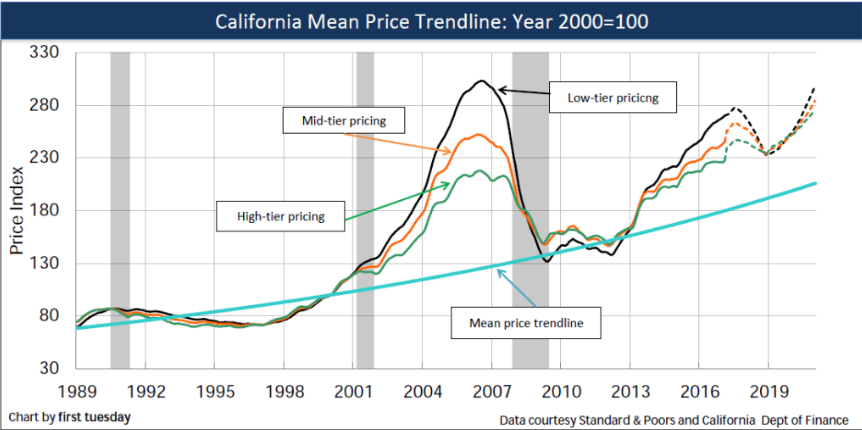
Low-Tier Pricing
As you can see, the low-tier pricing tends to run the longest while the “smart money” begins to waiver earlier. In a recovery, the low-tier pricing bottoms last and then leads the market higher.
It has been well documented in my quarterly newsletter that the lower quadrant of the South Bay has been surging. I am also bullish on lower income areas throughout Los Angeles as they have not appreciated like the beach cities. Minimum wage is set to jump by over 30% in the next few years (see previous blog post here) and will aide these areas further. At this current moment in time, per the First Tuesday chart, things are shaping up in a similar manner if we were to have a price drop after the low tier reaches its peak.
High-Tier Pricing
That all said, the high-tier pricing in the South Bay has not slowed. Last year Manhattan Beach sold a record $21 million property on The Strand and a Hill Section record at $20 million on Pacific Avenue. And as mentioned in my last blog, Paseo de la Playa sold for a South Bay record this past month at $22,650,000. While Rolling Hills and the Palos Verdes luxury markets are a bit sluggish, the Beach Cities have shown no signs of slowing down from the Tree Section to The Esplanade.
Los Angeles
Los Angeles has a lot of economic drivers going for it. Google, Facebook, and Amazon are notably moving heavily into Silicon Beach with Culver City and Playa Vista as their next big hubs. Snapchat continues to gobble up office space in Santa Monica and Los Angeles is surging onto the world stage with light rail transportation, the 2028 Summer Olympics, and perhaps even a 2026 World Cup bid.
As big tech moves to South Bay adjacent cities, our micro-market looks to be stable for now and into the future. But, when New York City starts to show cracks in their market, it is always prudent to take a step back and make sure your own local thesis still works.
South Bay Locals
According to Unison’s 2018 Home Affordability report, one needs to earn $292,000 to afford a $1.3 million home with 20% down.
If you read my past blog on tax reform, I mentioned the median home price in the Beach Cities and Palos Verdes is around $1,290,000 and gave it a $230,000 salary per year to afford.
Per City-Data.com, the median income around the South Bay is below:
$99,496 Redondo Beach
$128,435 Hermosa Beach
$153,332 Manhattan Beach
Over $200,000 Palos Verdes Estates
$127,718 Rancho Palos Verdes
$137,308 Rolling Hills Estates
Does the median income add up to afford a $1,300,000 home? No…but has it ever? Renters and second homeowners can skew these numbers as well as Millennials with wealthy families assisting on down payments.
Although the job market and the greater Los Angeles economic environment look to be bright, we still need to watch foundational data like median income and potential leading cities like NYC and San Francisco. This topic requires much more than a weekly blog post. But if you asked me where does the South Bay go from here?
Short answer: I am not sure.

Richard Haynes
DRE: 01779425
For more South Bay real estate insights, subscribe and follow Richard’s social channels below:
A leader in South Bay real estate for the better part of a decade, Richard thrives as an advisor to his clients with over $248 million in sales as a broker or investment principal at his boutique agency, Haynes. Richard is known for his keen local market insights which have been featured in the L.A. Times, The Street, and Forbes, along with his weekly South Bay real estate blog. [read more]