Every so often I write about The California Association of Realtors (C.A.R.’s) housing affordability numbers as I believe they are a great indicator of whether a market has more room to run or might lose some steam.
For past blog articles, please reference these links below:
- “California Housing Affordability: Strength or Weakness for Prices?”
- “South Bay Real Estate: 2018 Data for Homeowners”
For this week, I am going to give you an update on California’s statewide affordability numbers, along with the county of Los Angeles’ numbers. Further, I am going to take the new Census median income data and apply it to South Bay median prices/minimum qualifying income to buy a home.
C.A.R’s Housing Affordability Numbers
The California Association of Realtors recently released their housing affordability index number for quarter one of 2021. I like to keep a close eye on statewide and Los Angeles County numbers.
These numbers are important because it represents how much of the population can afford the median priced home. Statistics have shown that when prices get too bubbly, fewer people can afford homes; and vice versa, when more people can afford homes, then prices tend to be too low.
Statewide Affordability
For instance, after the Great Recession, in 2010 – 2012 more than 50% of Californians could afford the median priced home.
Conversely, at the heigh of the real estate bubble in 2006 and 2007, only about 12% of Californians could afford the median priced home.
So, where do we sit today statewide in quarter one of 2021?
That affordability number sits at 27%.
In 2018, we saw interest rates begin to rise and the South Bay market reacted by slowing down in 2019. During those two years, statewide affordability ranged between 26% and 31%. So even with prices 20% higher from three years ago, affordability remains mostly stable.
Thanks to low interest rates, about the same number of Californians can afford today’s home price even at much higher numbers.
Los Angeles Affordability
To try and keep affordability in a local context, let’s explore Los Angeles county’s affordability numbers produced by C.A.R.
In quarter one of 2021 in Los Angeles County, the affordability number sat at 25%.
If you look at my linked blog post from 2018, Los Angeles County was at 22% affordability at that time. So essentially, the numbers are saying that MORE people can afford homes in Los Angeles County today than three years ago. Seems crazy, right?
But, the numbers do not lie.
Prices would need to surge much higher, or interest rates would need to rise at a rapid pace to start making affordability levels worse. There is still a ways to go before getting nervous about prices overheating.
According to research from Bruce Norris, California typically sees prices peak in the 17% affordability range. He believes with tougher mortgage underwriting, prices could peak in the low 20’s. There is still room with the current 27% affordability we have statewide.
South Bay Median Income/Price/Qualifying Income
It is too difficult for me to calculate housing affordability in the South Bay because I do not have access to the income ranges for the population in each city.
I do, however, now have access to updated U.S. Census data on the median income of each city. We can compare how median income stacks up to the minimum qualifying income you need to afford a home in our local cities.
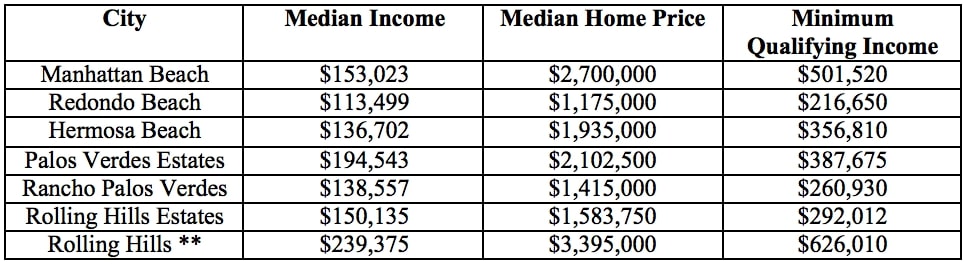
**The city of Rolling Hills did not have median income from the U.S. Census, so the information was pulled from datausa.io.
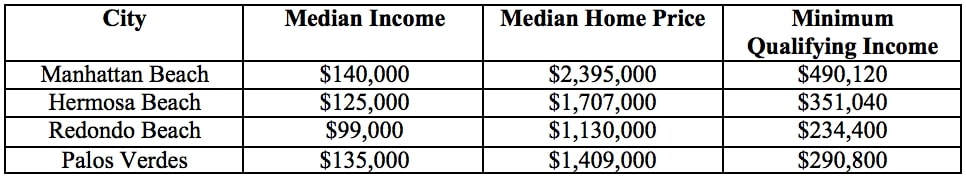
If you look at some of the numbers/chart from my 2018 post below, you can see that not too much has changed yet again. Median income is higher and in some cases, qualifying income to buy is lower relative to median income. Just look at Redondo Beach from 2018 to today.
The vast majority of residents cannot afford these prices, but that is the high-priced South Bay market for you, especially since the beach cities offer a lot more apartment units which allow for more affordable housing than the Palos Verdes Hill.
Conclusion
All in all, not much has changed since 2018 when it comes to affordability. Prices are way up, interest rates are way down and there is a supply/demand imbalance, but the market keeps rolling because buyers can afford it.
Sure, we saw a dip in prices in 2019 across the board from Palos Verdes to Manhattan Beach but we are more affordable today in 2021 when compared to 2018.
I am not speculating whether we go up or down (I believe we will stay very strong through the remainder of 2021), but these numbers are going to be key indicators to watch in the future. They help tune out the noise and allow you to make smart decisions when it comes to your real estate portfolio.
Cheers.

Richard Haynes
DRE: 01779425
For more South Bay real estate insights, subscribe and follow Richard’s social channels below:
A leader in South Bay real estate for the better part of a decade, Richard thrives as an advisor to his clients with over $248 million in sales as a broker or investment principal at his boutique agency, Haynes. Richard is known for his keen local market insights which have been featured in the L.A. Times, The Street, and Forbes, along with his weekly South Bay real estate blog. [read more]