
In last week’s blog titled, “How the “Stay-at-Home” Order is Affecting South Bay Real Estate,” I discussed how Governor Newsom’s order was affecting the real estate market based on our clients’ reactions and from an anecdotal standpoint.
Side Note: Our link to subscribe to the blog was down all last week. So if you subscribed between March 24th and April 1st, please subscribe one more time. Sorry!
Just last week, real estate agents were deemed non-essential upon the announcement. But on Saturday, the essential workers list was updated to expressly include “residential and commercial real estate services, including settlement services,” as produced by the Federal CISA under the Department of Homeland Security. A lot has changed!
With the conclusion of March, we now have end of the month data to give us hard evidence of what is happening in the market.
I have been estimated that sales were going to fall off a cliff in the short term future. Unfortunately, the data is most definitely confirming that we are heading in that direction like a run-a-away freight train.
Below, I am going to discuss the leading indicators, lagging indicators, and unemployment data to try and give you a hazy picture of how the real estate market is being affected.
Big Data on the MLS
All real estate markets are local. The Coronavirus, however, is a global pandemic and a large-scale macroeconomic event.
I want to start with a large chunk of data to get a bigger picture idea of the numbers and smooth out any outliers.
Our multiple listing service is CRMLS (California Regional Multiple Listing Service), which has various partner MLS’s and Associations that share data throughout the state of California. It includes greater Los Angeles and Orange County, chunks of San Diego county, and large regions of Northern California. Essentially, it covers a lot of the state.
So here is the March year-over-year data from the entirety of the CRMLS.
That is a lot of information to take in but let me try to break it down.
Last week, I mentioned that new listings and pending escrows will be the most important data as it will give us the best glimpse into the future and really tell us how the market will perform in the future.
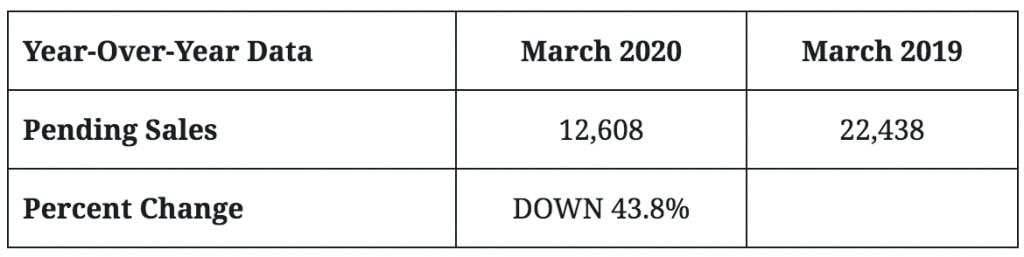
The most troubling statistic is the large drop of 43.8% in pending escrows. We are in the height of spring selling season and to see a drop of almost half of pending sales is BAD news.
Pending sales were likely hit hard due to canceled escrows thanks to Coronavirus uncertainty, as well as buyers and sellers waiting to delay their transactions during the second half of the month. If pending escrows drop by almost half, then closed sales will likely be cut in half in the next month or two as well.
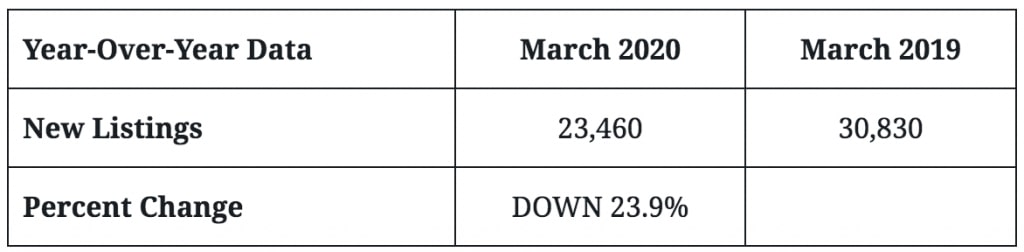
The same goes for new listings. Although not as bad, new listings were down 23.9%.
This number looks better because you can cancel a listing or put it on hold but it will not affect the new listing number. A drop in the overall supply like this is equally as bad as the drop in pending escrows.
I believe the new listing number could have been even lower if the rest-in-place orders occurred earlier in the month.
A full month of the “stay-at home” order and new listings could be down by 50%, or more.
Those two leading indicators are an ominous sign for the market.
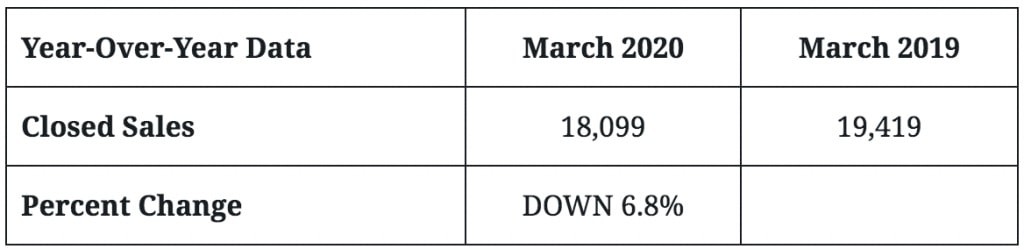
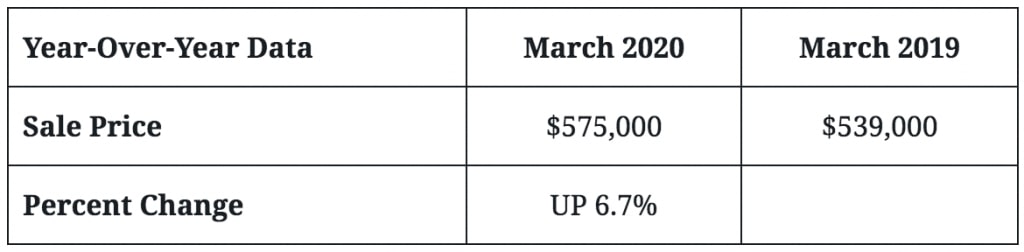
The lagging indicators are closed sales and sale price.
Closed sales were down 6.8% which is material. That said, these numbers probably will get thrown out the window as most of these escrows were from January and February deals well before the pandemic became a huge factor in March. So, closed sales will be much uglier in April.
The sale price of closings is up 6.7% which is great! It shows the strength of the early spring market. But again, these price gains were in a world pre-Coronavirus and massive layoffs. They will likely get worse.
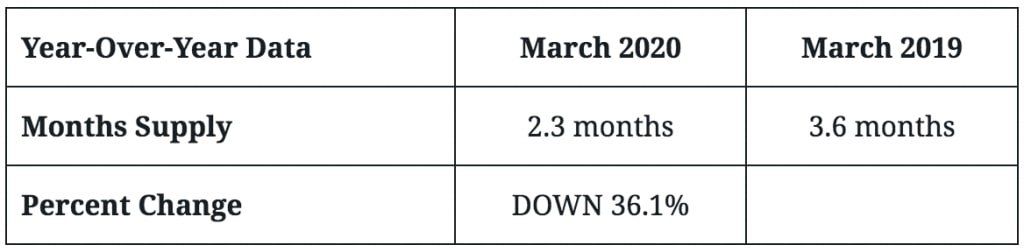
Last but not least is months supply. This is the most misleading statistic out there.
Most experts believe that six months supply is equilibrium. Anything below that is a seller’s market. So, 3.6 months supply last year versus only 2.3 months supply sounds like a hyper-sellers market. Right?
Wrong.
Please do not fall into the trap of real estate economists and real estate agents saying that supply is still low. Sure, supply is dropping, but, demand is dropping just as fast.
You could have one home on the market in your neighborhood that normally has 10 homes on market at a time, but if there are no buyers because they are nervous about their health, the economy, and/or their job, then that home will not sell.
This time it is different than most past real estate shocks. Months supply is not a factor until the virus and economic impacts become more clear.
All in all, the numbers from March 2020 compared to March 2019 are about as ugly as it gets. New listing and pending escrow numbers virtually guarantee a sharp drop in sales in the coming months unless we have a new drug breakthrough.
To make matters worse, March was really only affected for half of the month, so I expect the leading indicators to get worse in April along with closed sales to start falling as a result.
This will all result in price dislocations, up and down, and have implications for the real estate industry and overall economy.
Other Factors to Take into Account
Below are other factors that will have an effect on the real estate numbers.
Unemployment
In the past two weeks, initial jobless claims have touched almost 10 million.
During the Great Recession, the highest two week total was about 1.8 million claims. During 9/11, it was under 1 million.
This is a shock to workers and the economy like we have never seen before.
It will affect buying power…and maybe even some motivated sales if a sharp recovery does not happen soon.
Stock/Bond Market
The stock market is a great source of wealth for many home buyers. If the market is down 20% or potentially falls further, then access to down payment money get smaller.
In the bond market, some investors might get nervous that mass unemployment will lead to difficulty in making mortgage payments. If investors do not buy mortgage-backed securities, then loans outside of government-sponsored guarantees (Fannie Mae, Freddie Mae, Ginnie Mae, FHA, FHFA, etc.) could be harder to come by.
Mortgage Bankers Association
On a more positive note, mortgage applications were up 15.3% last week. A great number, right?
Again, unfortunately no.
When you break down the Mortgage Bankers Association (MBA) numbers, it was all driven by refinance activity and not purchases.
Refinances were up 168% from the same week a year ago.
Purchase loans were down 24% the same week a year ago.
These numbers are from the week ending March 27, 2020. That is a big drop for one week and we all know why.
Do these numbers go lower next week as it takes into account more and more states implementing “stay-at-home” orders? I am sure it will.
No good data anywhere.
Individual South Bay Cities
All markets are local, so below is the data for the four areas that I cover in the blog.
Your main focus should be on new listings and pending sales as that will give you a glimpse into the future market sales coming in April and May.
The rest of the data is a lagging indicator (with months supply thrown out as it is not applicable at this time).
Palos Verdes Peninsula (90274)
- New Listings
- March 2020: 46
- March 2019: 55
- Percent Change: DOWN 16.4%
- Pending Escrows
- March 2020: 13
- March 2019: 31
- Percent Change: DOWN 58.1%
- Closed Sales
- March 2020: 25
- March 2019: 31
- Percent Change: DOWN 19.4%
- Months Supply
- March 2020: 3.6 months
- March 2019: 5 months
- Percent Change: DOWN 28%
- Sale Price
- March 2020: $1,700,000
- March 2019: $1,594,000
- Percent Change: UP 6.6%
Palos Verdes Peninsula (90275)
- New Listings
- March 2020: 49
- March 2019: 66
- Percent Change: DOWN 25.8%
- Pending Escrows
- March 2020: 16
- March 2019: 43
- Percent Change: DOWN 62.8%
- Closed Sales
- March 2020: 31
- March 2019: 40
- Percent Change: DOWN 22.5%
- Months Supply
- March 2020: 2.9 months
- March 2019: 3.2 months
- Percent Change: DOWN 9.4%
- Sale Price
- March 2020: $1,255,000
- March 2019: $1,302,900
- Percent Change: DOWN 3.7%
Hermosa Beach
- New Listings
- March 2020: 16
- March 2019: 25
- Percent Change: DOWN 36%
- Pending Escrows
- March 2020: 6
- March 2019: 18
- Percent Change: DOWN 66.7%
- Closed Sales
- March 2020: 20
- March 2019: 18
- Percent Change: UP 11.1%
- Months Supply
- March 2020: 3.2 months
- March 2019: 3.5 months
- Percent Change: DOWN 8.6%
- Sale Price
- March 2020: $1,637,500
- March 2019: $1,612,500
- Percent Change: UP 1.6%
Manhattan Beach
- New Listings
- March 2020: 43
- March 2019: 63
- Percent Change: DOWN 31.7%
- Pending Escrows
- March 2020: 13
- March 2019: 47
- Percent Change: DOWN 72.3%
- Closed Sales
- March 2020: 23
- March 2019: 39
- Percent Change: DOWN 41%
- Months Supply
- March 2020: 3.7 months
- March 2019: 3.9 months
- Percent Change: DOWN 5.1%
- Sale Price
- March 2020: $2,500,000
- March 2019: $2,195,000
- Percent Change: UP 13.9%
Redondo Beach (including Hollywood Riviera)
- New Listings
- March 2020: 92
- March 2019: 102
- Percent Change: DOWN 9.8%
- Pending Escrows
- March 2020: 19
- March 2019: 93
- Percent Change: DOWN 79.6%
- Closed Sales
- March 2020: 55
- March 2019: 79
- Percent Change: DOWN 30.4%
- Months Supply
- March 2020: 2.0 months
- March 2019: 2.1 months
- Percent Change: DOWN 4.8%
- Sale Price
- March 2020: $1,130,000
- March 2019: $975,000
- Percent Change: UP 15.9%
As you can see, our data mirrors some of the big data.
New listings, for the most part, have fallen less than the big MLS data.
Unfortunately, our local markets pending sales have been hit harder ranging from 58.1% to 79.6% drops which far exceed that the 43.8% drop in the overall MLS.
I will continue to analyze the new data as it comes and begin to apply what it means for our local markets. We should be able to shine light on how things are shaping up in April.
As sales drop and uncertainty remains, I expect to see values become a bit unstable. There will be price discovery on what a property is worth during a time with a pandemic, mass unemployment, and a likely recession.
Prices can move either way depending on the market.
For some, the best move could be to remain patient buying or selling (if you can).
And for others, the best move could be to act quickly to land a great deal or sell at a premium.
At this moment, it is still unclear how real estate prices will react.
But one thing is for certain, sales are going to get hit very hard next month. And, my guess is that the numbers will get even worse in April.
We’ll continue to sort through the data and market.
See you next week.

Richard Haynes
DRE: 01779425
For more South Bay real estate insights, subscribe and follow Richard’s social channels below:
A leader in South Bay real estate for the better part of a decade, Richard thrives as an advisor to his clients with over $248 million in sales as a broker or investment principal at his boutique agency, Haynes. Richard is known for his keen local market insights which have been featured in the L.A. Times, The Street, and Forbes, along with his weekly South Bay real estate blog. [read more]